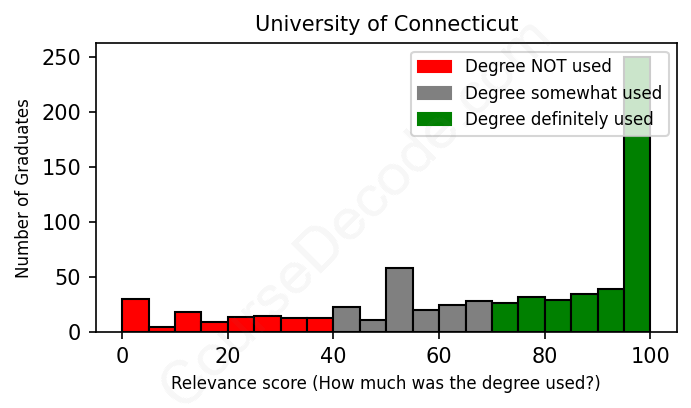
Of all the University of Connecticut graduates we've analyzed, here's how many have used (or NOT used) their degree in their career according to our analysis:

Note this will be heavily influenced by the type of degrees the graduates from University of Connecticut have done.
Below are all the degrees University of Connecticut offers where we've analyzed at least 10 of their graduates who did that degree:
| Field | Score | Count |
|---|---|---|
 Psychology Psychology
|
65 | 42 |
 Communication Communication
|
63 | 30 |
 Health Services Health Services
|
78 | 26 |
 Economics Economics
|
63 | 23 |
 Biology Biology
|
65 | 22 |
 Human Development And Family Studies Human Development And Family Studies
|
72 | 22 |
 Mechanical Engineering Mechanical Engineering
|
77 | 19 |
 Nursing Nursing
|
98 | 15 |
 Biochemistry Biochemistry
|
59 | 15 |
 Biomedical Sciences Biomedical Sciences
|
74 | 15 |
 Political Science And Government Political Science And Government
|
45 | 13 |
 Political Science Political Science
|
70 | 12 |
 Computer Science Computer Science
|
86 | 11 |
 Chemical Engineering Chemical Engineering
|
70 | 11 |
 Nutrition Sciences Nutrition Sciences
|
85 | 11 |
 Finance Finance
|
87 | 10 |
 History History
|
60 | 10 |